Hi!
For those who don’t know chart.js, it’s a javascript chart library.
Using a library for creating data visualization can be a little painful when you want something beyond the examples and styles provided by those libraries.\ I’ve decided creating this post when I spent a lot of effort to customize a doughnut chart style, cause I needed to use a custom legend style for that chart.
This is what you can create without any custom styling:
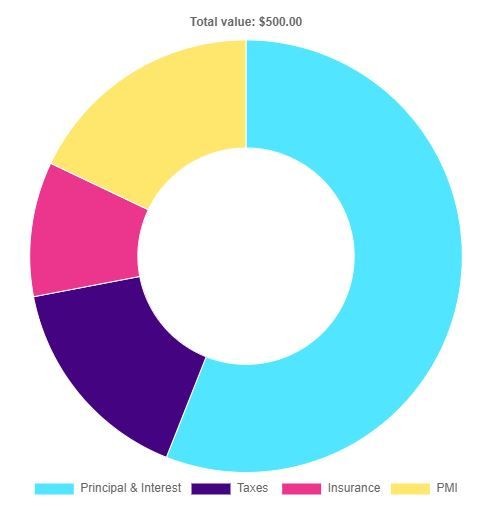
So going deep into the documentation, there is a legendCallback option that enables us to insert a HTML legend to the chart and this will be rendered once we call generateLegend() function from chart.js.
This is what my legendCallback looks like:
1legendCallback: (chart) => {2 const renderLabels = (chart) => {3 const { data } = chart;4 return data.datasets[0].data5 .map(6 (_, i) =>7 `<li>8 <div id="legend-${i}-item" class="legend-item">9 <span style="background-color:10 ${data.datasets[0].backgroundColor[i]}">11 12 </span>13 ${14 data.labels[i] &&15 `<span class="label">${data.labels[i]}: $${data.datasets[0].data[i]}</span>`16 }17 </div>18 </li>19 `20 )21 .join("");22 };23 return `24 <ul class="chartjs-legend">25 ${renderLabels(chart)}26 </ul>`;27 },
Here I’m mapping through all elements in the dataset and getting it’s background color and label (previously defined inside the charts options object).
With this HTML + some CSS I can generate something like this:
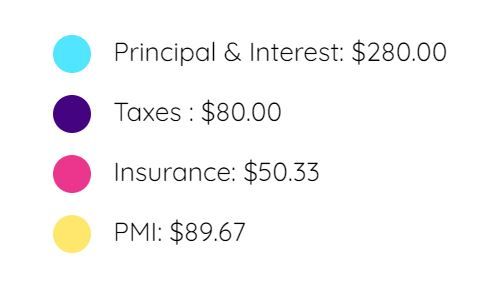
YES! JOB DONE!
… actually not quite ;)
WHAT?
yup, until this point we have the legend style but if we click on it, nothing happens on the chart… we don’t have that excluding data animation as if we were using the default legend.
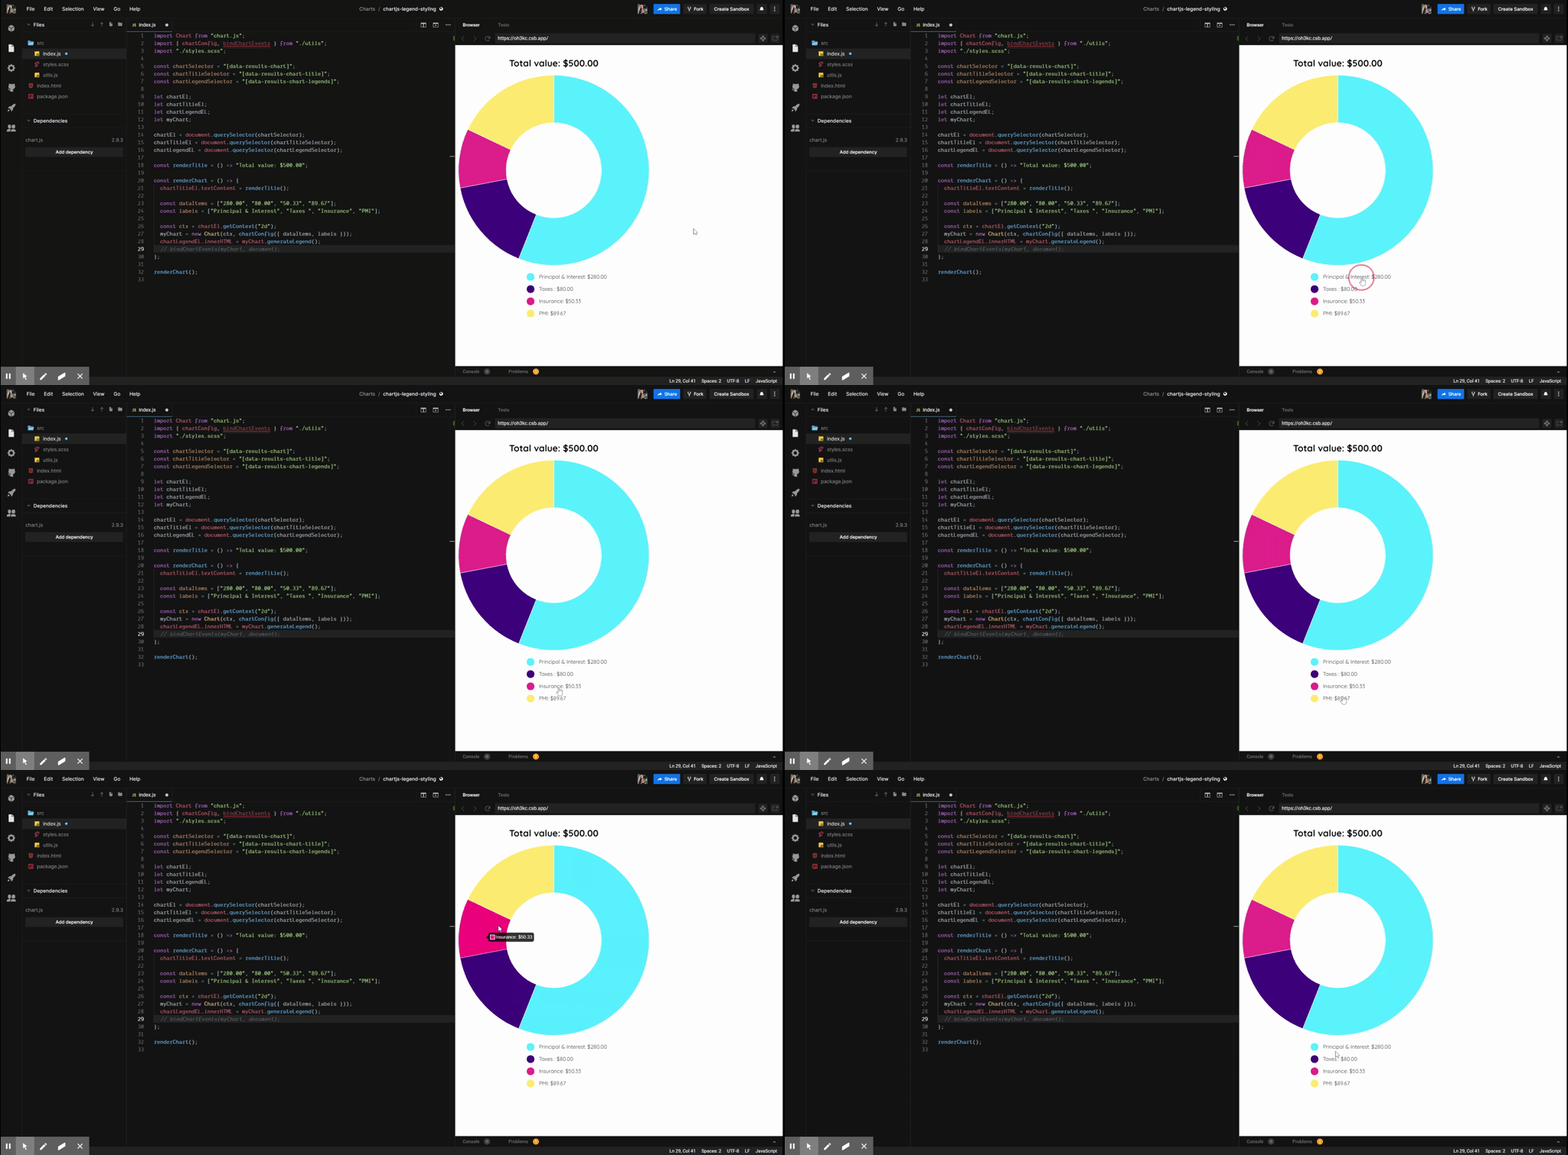
We need to create click event listeners for each legend:
1const legendItemSelector = ".legend-item";2const labelSeletor = ".label";34const legendItems = [...containerElement.querySelectorAll(legendItemSelector)];5legendItems.forEach((item, i) => {6 item.addEventListener("click", (e) => updateDataset(e.target.parentNode, i));7});
And then based on the current state of the data (available in this getDatasetMeta function) from the legend you clicked, you can hide and show that data in the chart:
1const updateDataset = (currentEl, index) => {2 const meta = myChart.getDatasetMeta(0);3 const labelEl = currentEl.querySelector(labelSeletor);4 const result = meta.data[index].hidden === true ? false : true;5 if (result === true) {6 meta.data[index].hidden = true;7 labelEl.style.textDecoration = "line-through";8 } else {9 labelEl.style.textDecoration = "none";10 meta.data[index].hidden = false;11 }12 myChart.update();13};
Together they look like this:
1export const bindChartEvents = (myChart, containerElement) => {2 const legendItemSelector = ".legend-item";3 const labelSeletor = ".label";45 const legendItems = [6 ...containerElement.querySelectorAll(legendItemSelector),7 ];8 legendItems.forEach((item, i) => {9 item.addEventListener("click", (e) =>10 updateDataset(e.target.parentNode, i)11 );12 });1314 const updateDataset = (currentEl, index) => {15 const meta = myChart.getDatasetMeta(0);16 const labelEl = currentEl.querySelector(labelSeletor);17 const result = meta.data[index].hidden === true ? false : true;18 if (result === true) {19 meta.data[index].hidden = true;20 labelEl.style.textDecoration = "line-through";21 } else {22 labelEl.style.textDecoration = "none";23 meta.data[index].hidden = false;24 }25 myChart.update();26 };27};
And now we are able to click and have those chart.js animations:
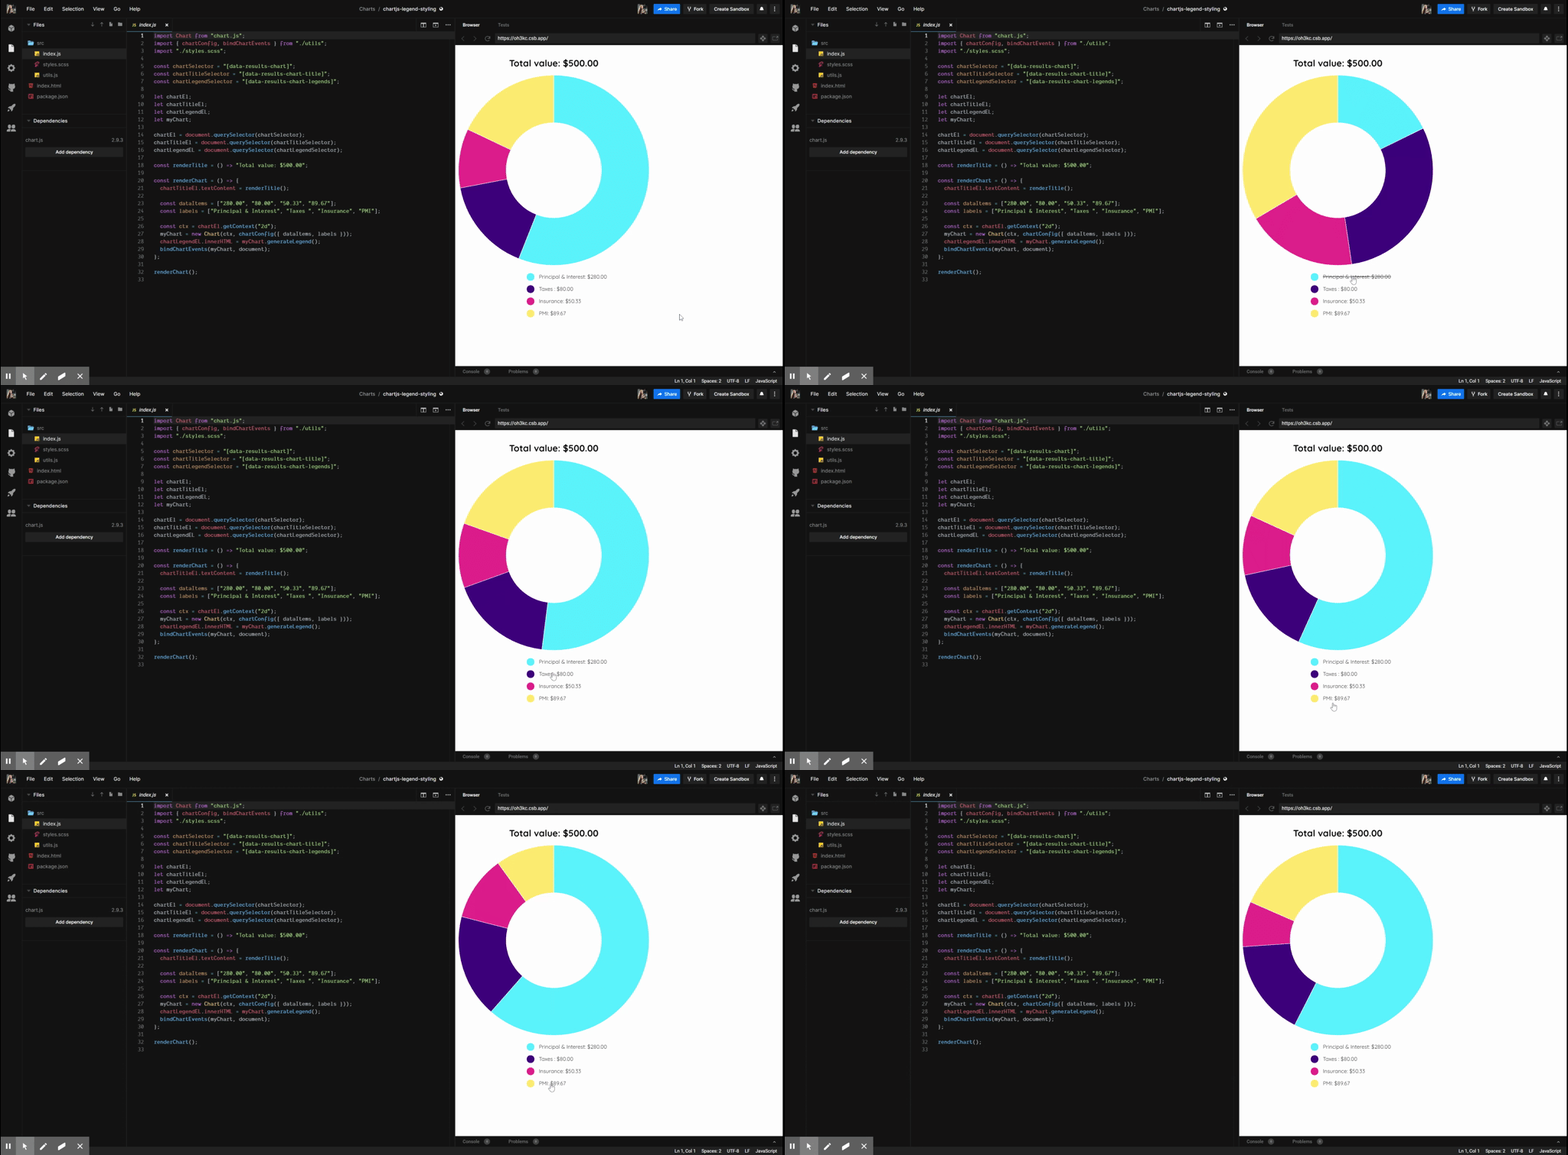
This post is more focused on the custom styling so if you are curious about how to create a chart.js chart and make that work, here is the example that you can take a look 😄

